
Trading Tip
Hello to another Trading Tip,
i want show you how you can better trade with NinjaTrader and the Indicator Trader strategy.
I want show you 3 indicators what can help you very much in your day trading
The Williams %R
The BOP -Balance of Power
and the TSF Time Series Forecast
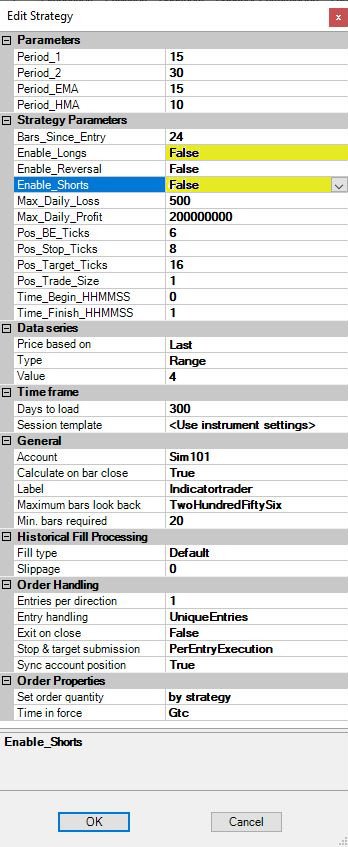
Now first we open the Indicatortrader Strategy and set the Strategy how in the picture explained. Please reassure yourself that the long and short are disabled.

If you have don this you can start your replay or Live data feed and strategy.
Now you get several bars in the chart were you open the Indicatortrader Strategy, like this on the next picture.
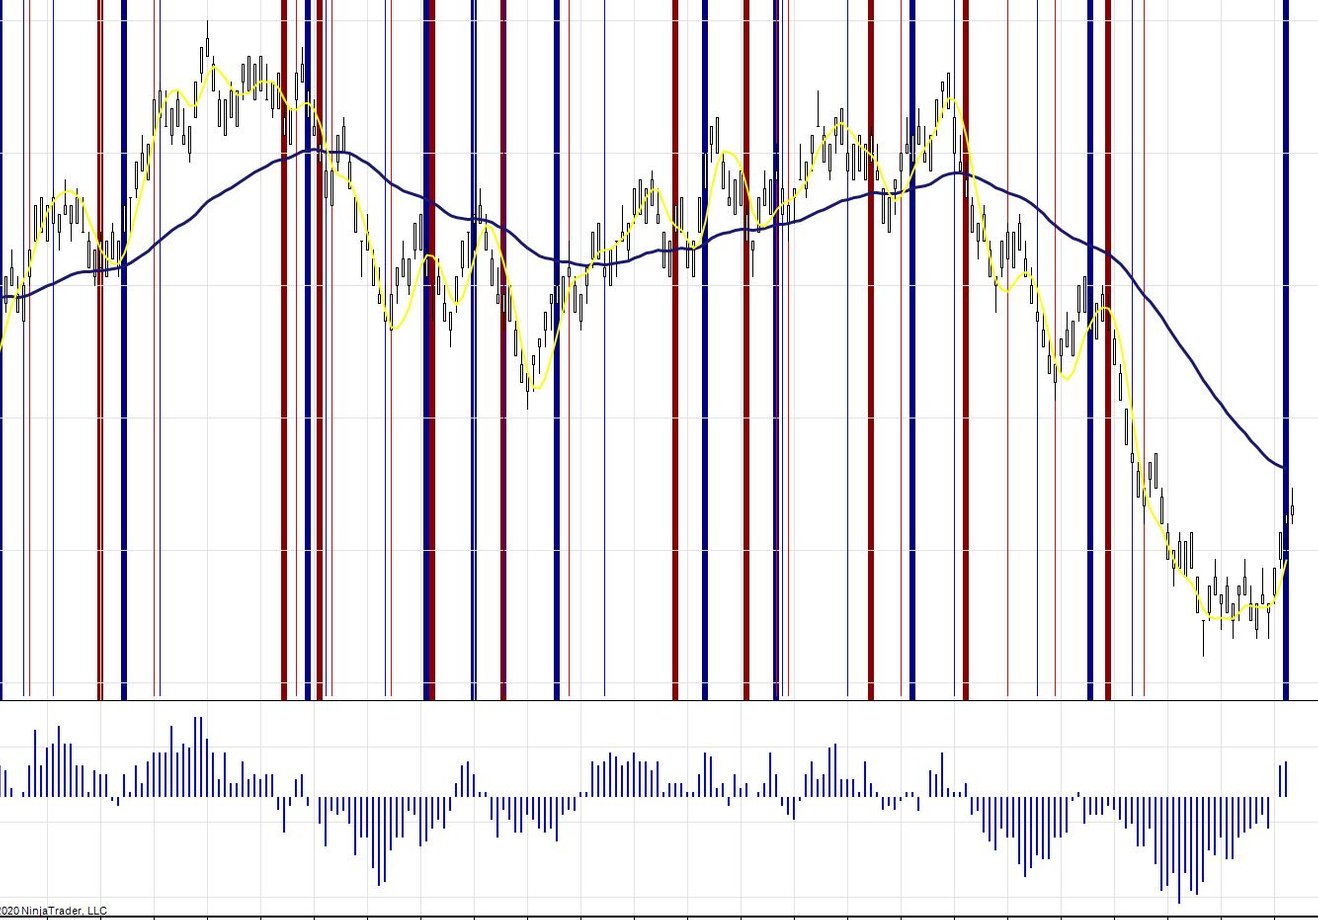
You will see you have big blu lines and big red lines, if a small red line cam after a big red line, this is the signal what you waiting for in a down trend,here we look for trades.
In a up trend cam a smal blu line after a big Blu line.
In this down trend we have 3 small red lines after a big red line,
here we can search for trades.
But we must search for better hints that the trade works well.
For this we use the indicators Williams %R , the BOP -Balance of Power
and the TSF Time Series Forecast.
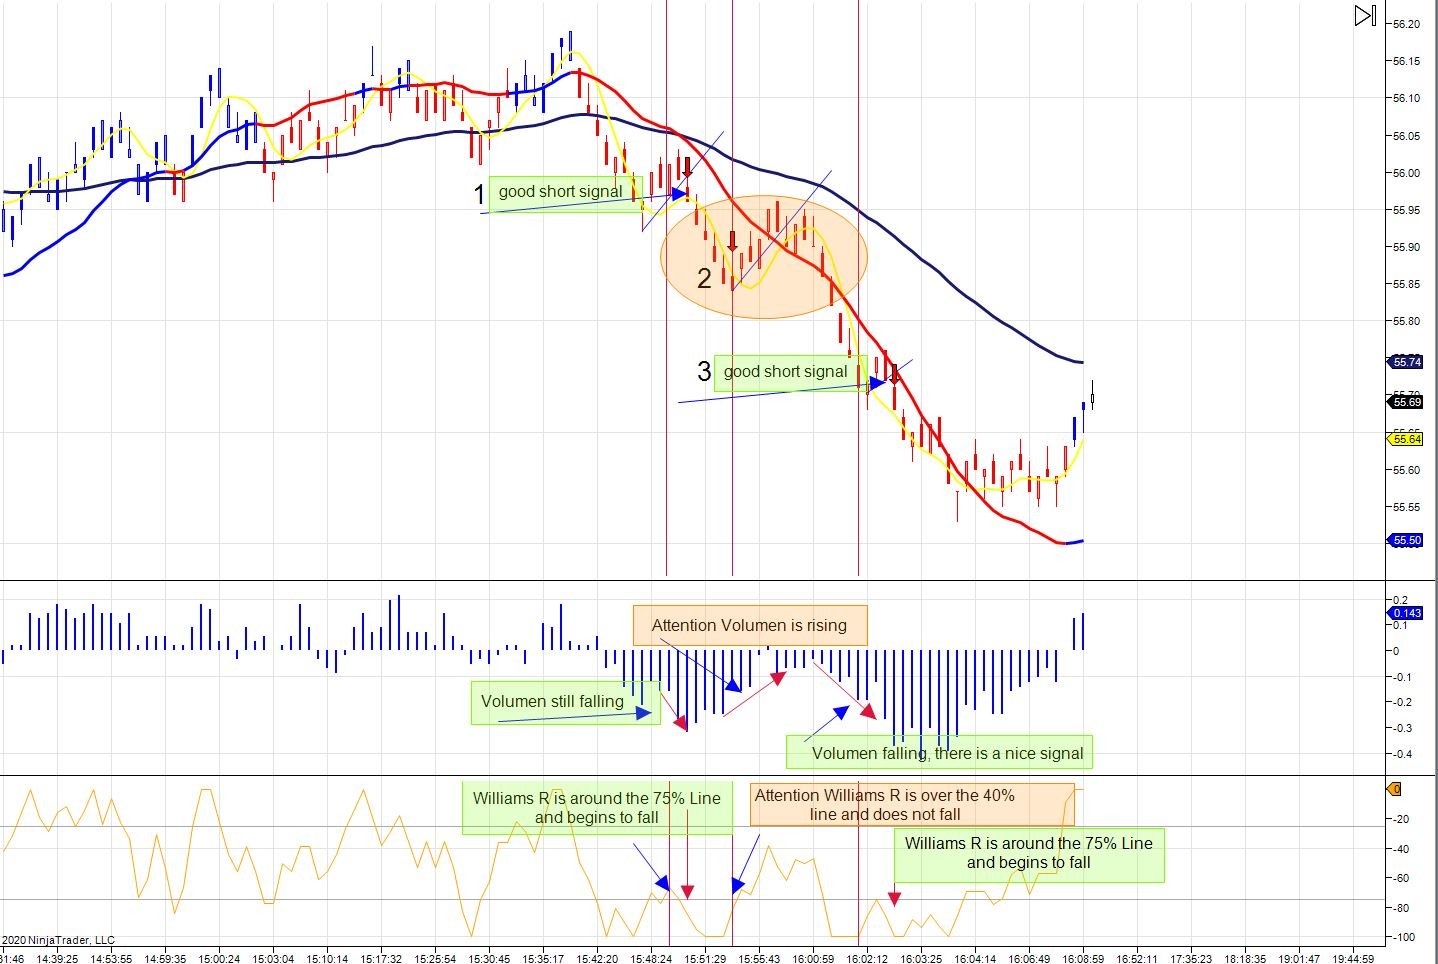
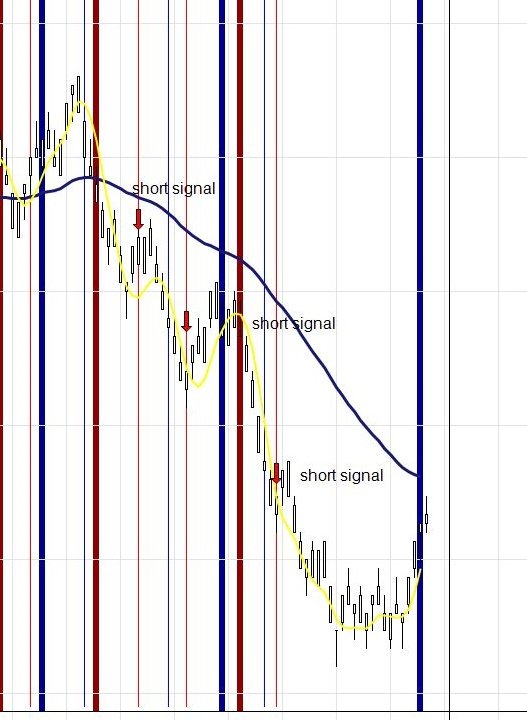
In this picture i activate the 3 indicators the TSF Time Series Forecast
is the red line what change color to blue if the trend rise and paint all candles to the actual color red or blue.
This line and candels is in the downtrend red and stay red also in the corecture phase were we have the smal red lines of the Indicatortrader Strategy.
After check the TSF we take a look to the BOP-Balance of Power, this is the indicator in the middle of the chart with the blu sticks, here we see if the volume is falling or not.
And the last indicator is the Williams %R this is the Oscillator down in the picture.
Trade 1, for a good trade the Williams %R must fall, if the candel close bilo the corectur trendline in the chart (smal blu line indicatet with the arrow in the chart) if in tis moment that the prise fals under the trendline and the Williams %R is not over 50% and is falling the BOP volumen and the TSF is red you can are very sure that the trade works for well.
Trade 2, If the signal is not so clear wit this tre indicators so a good working trade is not sur but so long the TSF is not changing color you can take the trade.
I recommend also to take a look at higher time frames so you can look well were are the next resistance line.
I hope this tip can help you to trade better and you use the Inticatortrader Strategy.
Regards
Gabriel Coletta
Indicatortrader
Analysis
Hello
today i want show you a way how you can take profit of a not optimal working market.
It happens often that i find a setup what not work for 100%
Here i show you a cumulative profit of a NinjaTrader test. You can see that the setup work not
perfect but sometimes have rising pases.
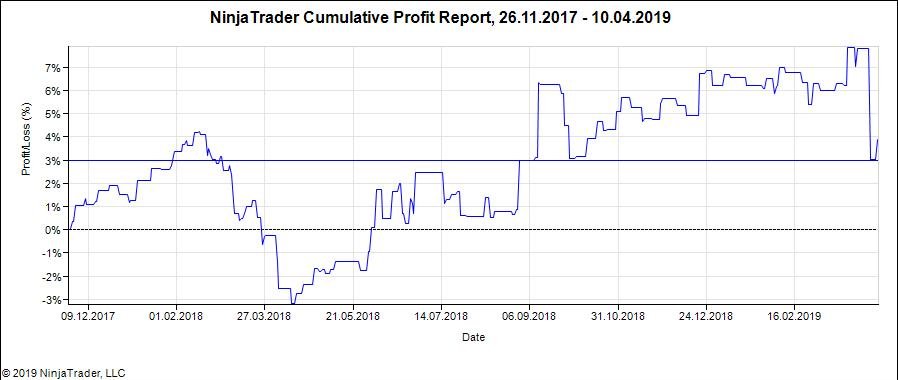
I preferate market phases what have a rising cumulative profit. So if i see a market phase like this i
can start me strategy.
Here i wait in a rising market pase up to a positive trade are concluded,
now i start the strategy and let run the strategy so long up to a negative trade are concluded now i
stop the strategy and add up the tradeprofit profit.
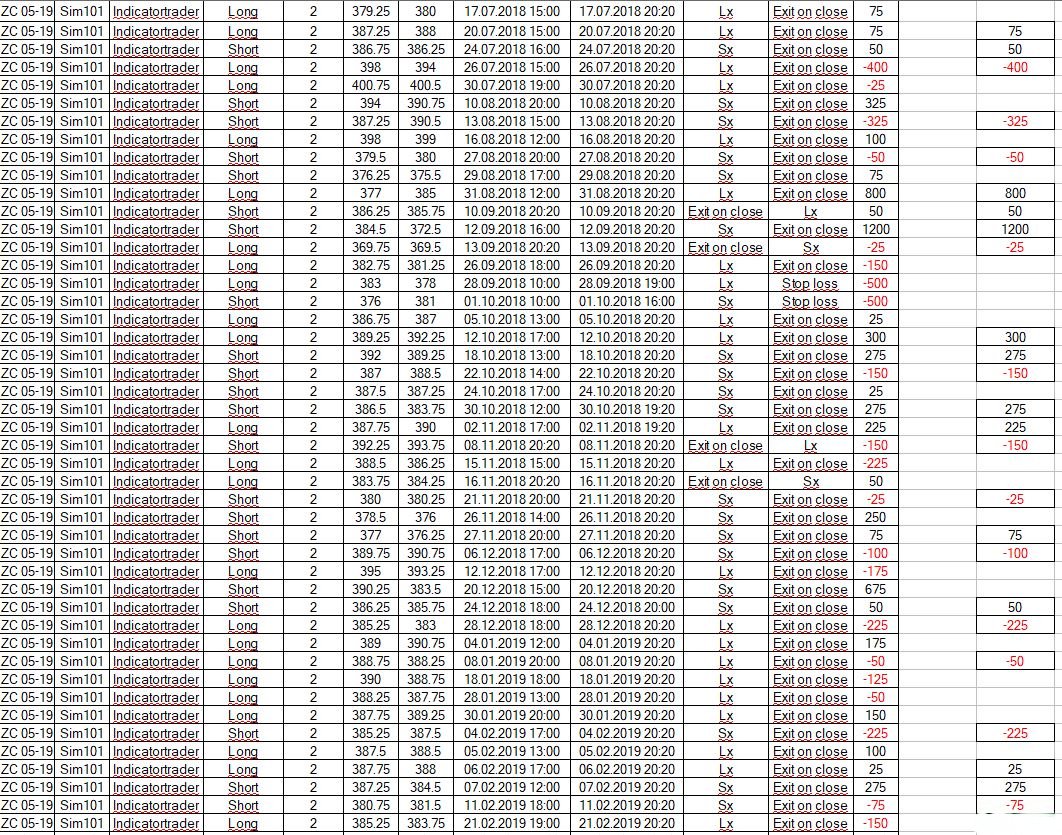
Here i add up the result
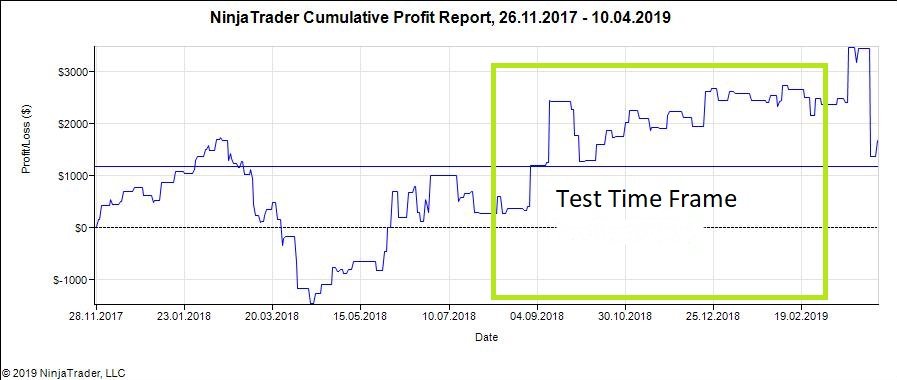
This is the Tested timeframe
Definitely is a question of luck if i can generate profits with this strategy, but the Opportunities risk
ratios is on the top. You risc 150$ buying an account by Topsteptrader and you can winn a multiple
of the commitment.
Certainly you must observe more than one market to reach the monthly account target but with this
sistem is not impossible to reach the target.
I hope i can help you to reach your aims in trading and i am very pleased if i hear from you for a 2
month free trial.
Regards
Gabriel Coletta
Hello,
this time i want show you the backtest function of NinjatTrader on stock chart.
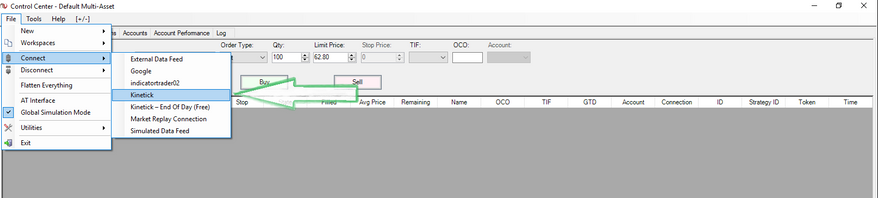
first step,connect your Ninjatrader on a data feed what can offer Stockdata,
in my case is this kinetick.
After can open the strategy analyzer....
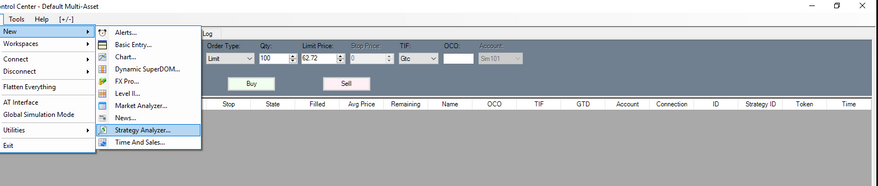
I made here an example, i put all SP500 stocks with the initial letter A in the default list.
Now i begin running backtest,
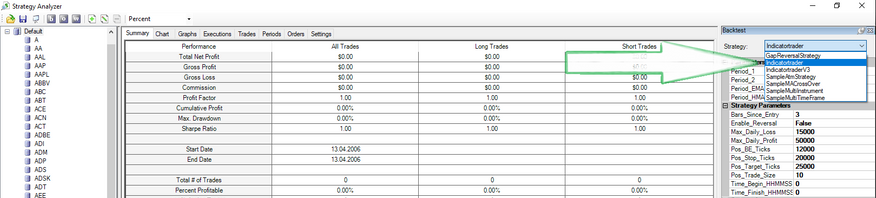
choose in the backtestmenu Indicatortraderstrategy
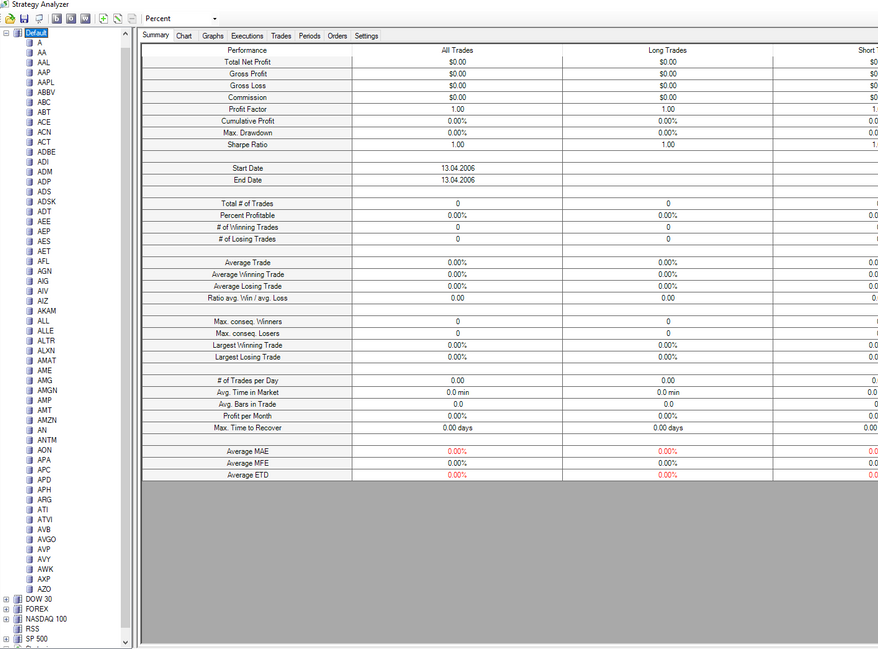
Now you can see the Strategy analyzer off NinjaTrader.
With this toll you can test fast many instruments I use my strategy
IndicatorTrader strategy
Hello,
this time i want show you the backtest function of NinjatTrader on stock chart.
Now you can insert my parameter or analyse charts at your own to find out the best working parameter for the Stock
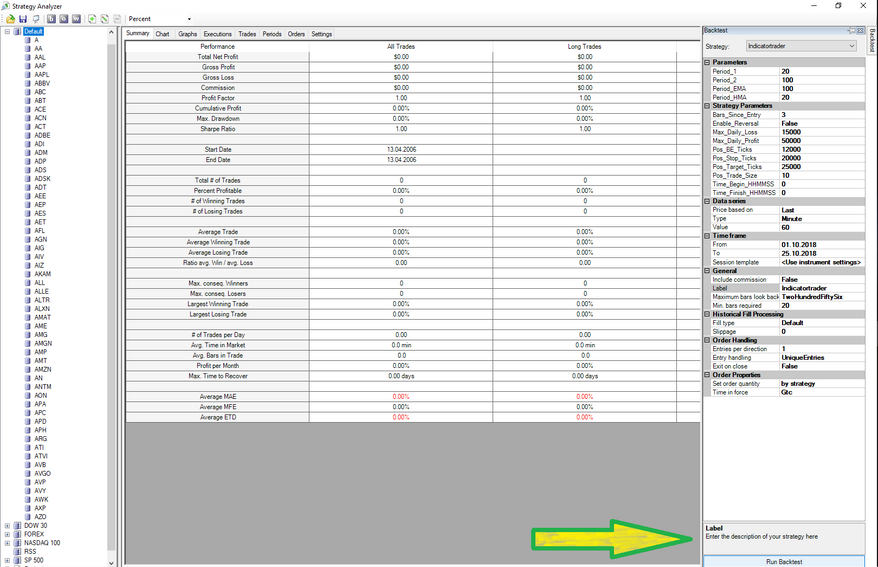
Now push the button Run Backtest!
NinjaTrader download the necessary data and in a couple of seconds show you the result.
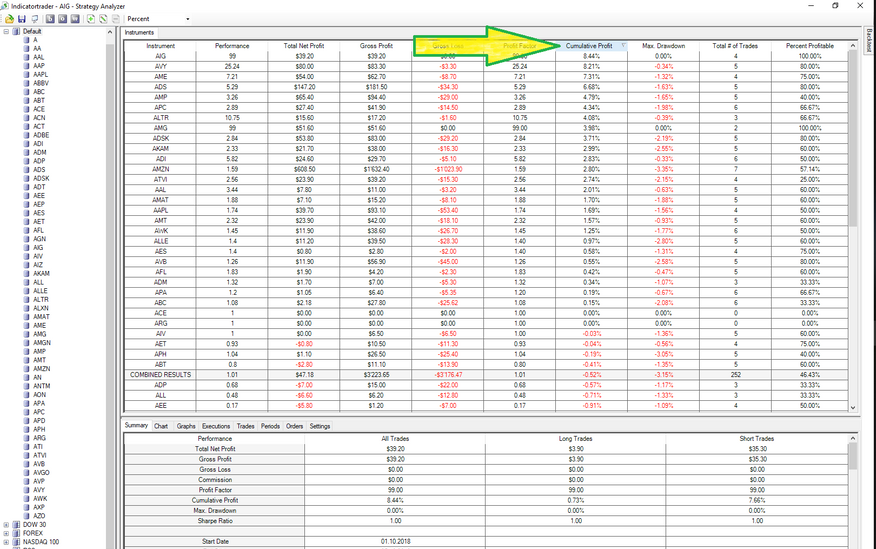
If you click on cumulative profit you refresh the list and the best performing stocks are on the top
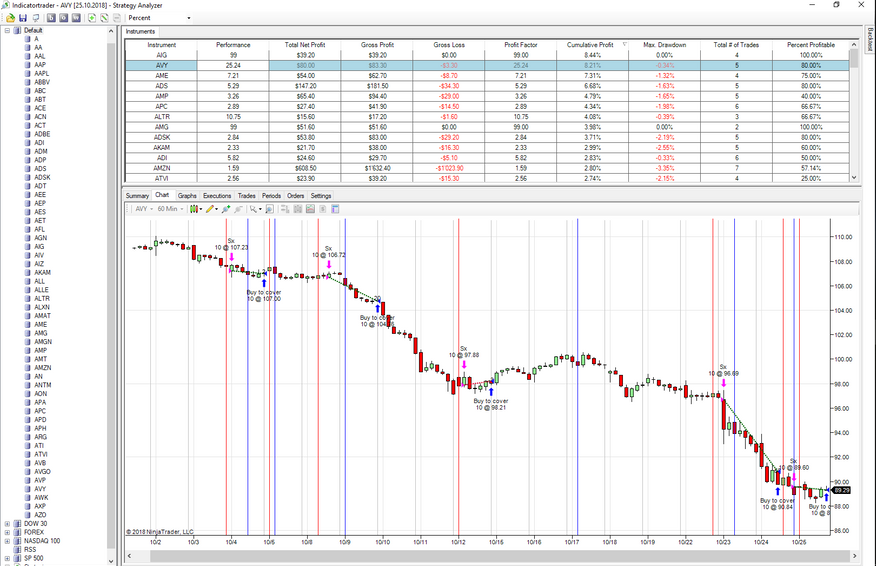
In the riter Chart you see the trades made by the strategy connected with a green or red line you can see the profit on the top of the conclusing trade arrow so you can set up the right ordersize for your portfolio.
I wish you anytime nice trades
Regards
Gabriel Coletta